“October: This is one of the peculiarly dangerous months to speculate in stocks. The others are July, January, September, April, November, May, March, June, December, August, and February.” Mark Twain
After a historic 60% rally, stocks pulled back in September before a late-month bounce. In the end, the S&P 500 Index fell 3.9% but was still up a very impressive 8.5% for the historically weak third quarter. As we noted three months ago after the S&P 500 gained 20% in the second quarter, continued strength was likely, and it played out well once again.
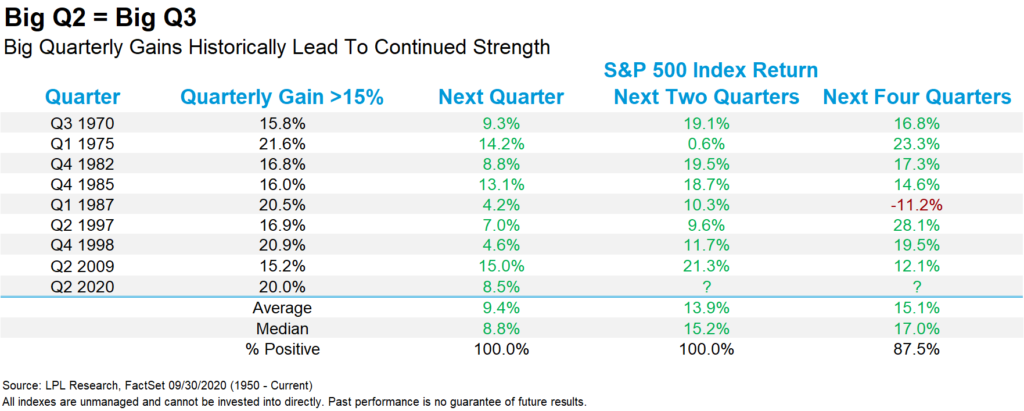
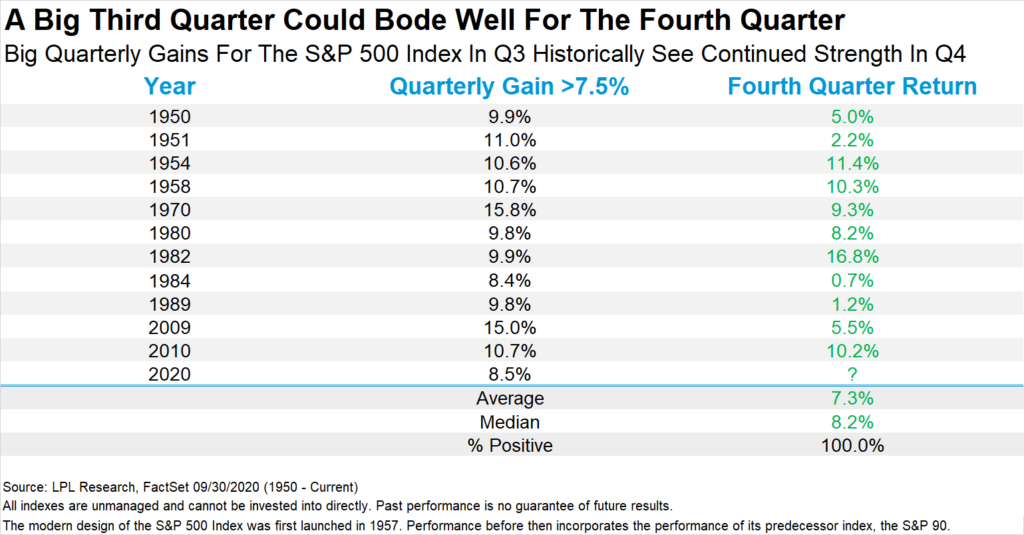
The good news? A big third quarter tends to point toward higher prices in the future. “Here’s the catch: The third quarter is usually weak, but when it is really strong like it was in 2020, this says the rally isn’t over yet,” explained LPL Financial Chief Market Strategist Ryan Detrick. “In fact, after it gained more than 7.5% in the third quarter, the fourth quarter gained the past 11 times.”
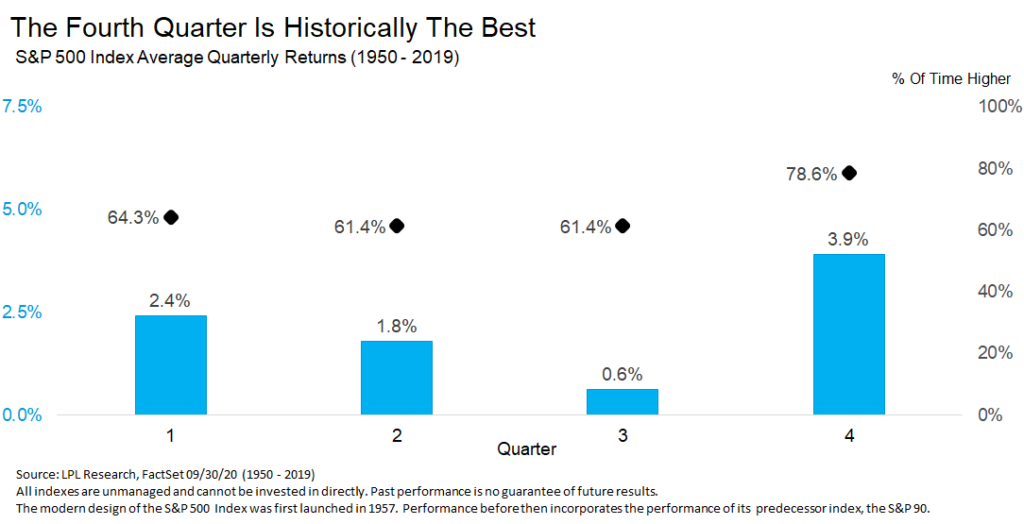
Here’s how all four quarters have performed historically. The fourth quarter has been higher nearly 79% of the time and up 3.9% on average, ranking the fourth as the best out of the four quarters of the year.
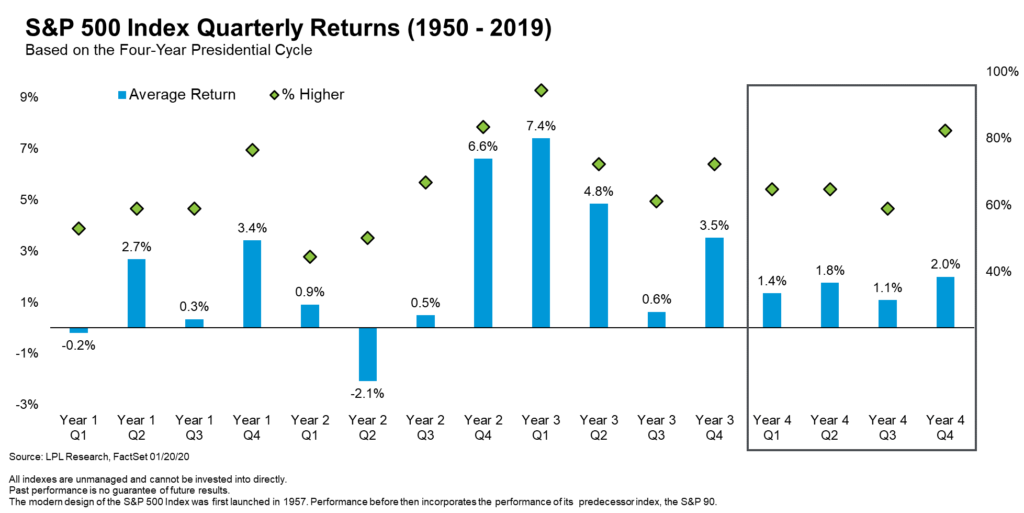
However, this is an election year, so let’s break it down by the presidential cycle. As shown in the LPL Chart of the day, the fourth quarter during an election year is up 2% on average but finishes higher a very impressive 82% of the time.
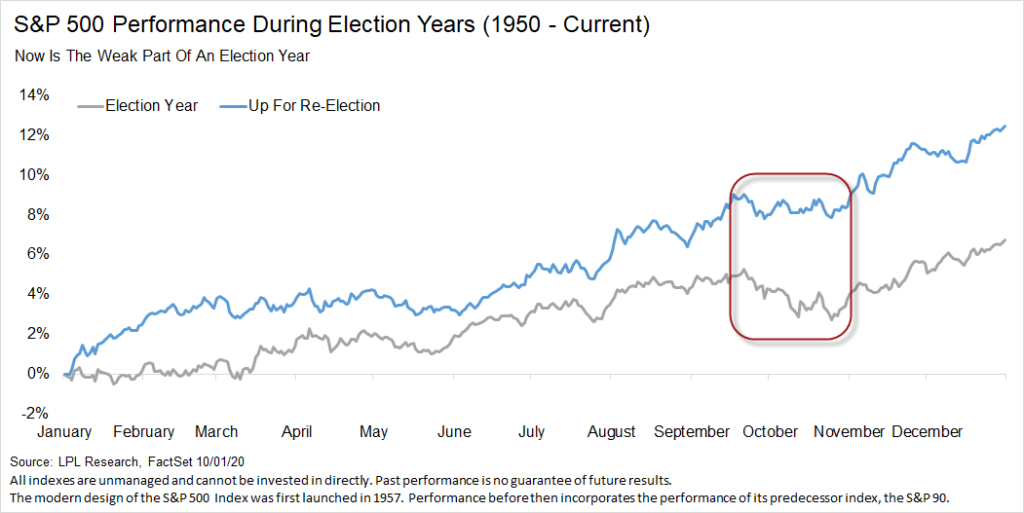
Looking at things based on seasonality, this is the weakest time of year. During an election year, stock prices tend to be weak from now until late October, but when a president is up for reelection, more sideways action is normal. Either way, we would say the calendar is one of the biggest worries in the near term.
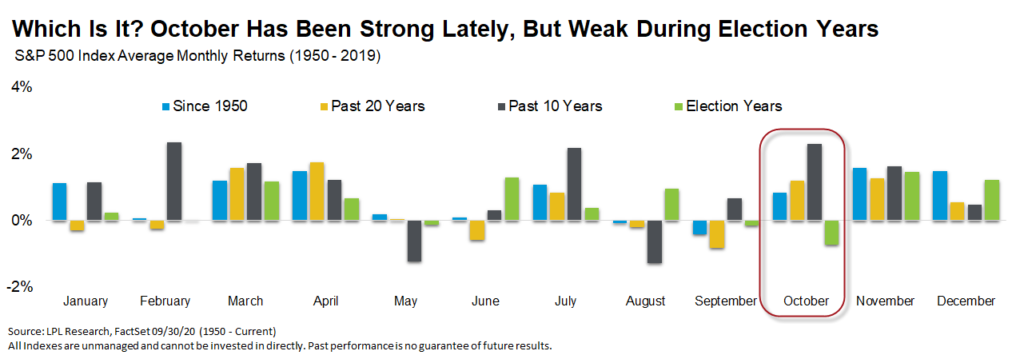
Lastly, what about October? Well, this month has tricks and treats for nearly everyone. Over the past decade, it ranks as the second-best month of the year, while it is the worst month of the year during an election year. It is known for crashes like in 1929, 1987, and 2008, but overall the month is actually not that bad, ranking as the seventh-best month since 1950. So in the end, we’d say this month is more misunderstood than most think.
The modern design of the S&P 500 stock index was first launched in 1957. Performance back to 1928 incorporates the performance of the predecessor index, the S&P 90.
Please watch our recent LPL Market Signals video, where Ryan and Jeff Buchbinder discuss current market trends.
You can watch the full discussion below and direct from the LPL Financial YouTube channel. Please be sure to subscribe to the LPL Research YouTube channel, so you don’t miss anything!
IMPORTANT DISCLOSURES
This material is for general information only and is not intended to provide specific advice or recommendations for any individual. There is no assurance that the views or strategies discussed are suitable for all investors or will yield positive outcomes. Investing involves risks including possible loss of principal. Any economic forecasts set forth may not develop as predicted and are subject to change.
References to markets, asset classes, and sectors are generally regarding the corresponding market index. Indexes are unmanaged statistical composites and cannot be invested into directly. Index performance is not indicative of the performance of any investment and do not reflect fees, expenses, or sales charges. All performance referenced is historical and is no guarantee of future results.
Any company names noted herein are for educational purposes only and not an indication of trading intent or a solicitation of their products or services. LPL Financial doesn’t provide research on individual equities. All information is believed to be from reliable sources; however, LPL Financial makes no representation as to its completeness or accuracy.
All index and market data from FactSet and MarketWatch.
This Research material was prepared by LPL Financial, LLC.
Securities and advisory services offered through LPL Financial (LPL), a registered investment advisor and broker-dealer (member FINRA/SIPC).
Insurance products are offered through LPL or its licensed affiliates. To the extent you are receiving investment advice from a separately registered independent investment advisor that is not an LPL affiliate, please note LPL makes no representation with respect to such entity.
- Not Insured by FDIC/NCUA or Any Other Government Agency
- Not Bank/Credit Union Guaranteed
- Not Bank/Credit Union Deposits or Obligations
- May Lose Value
For Public Use – Tracking 1-05039378