Market Blog
The September weakness continued with the S&P 500 Index 9.6% off the all-time high set on September 2 (as of 9/23/20). It is important to remember that after a 60% rally in the S&P 500—and much more in some of the large-cap tech stocks—this type of seasonal weakness is normal and expected. We noted in our blog Historic August Opens Door To Worst Month Of The Year that some type of seasonal weakness could be in the cards.
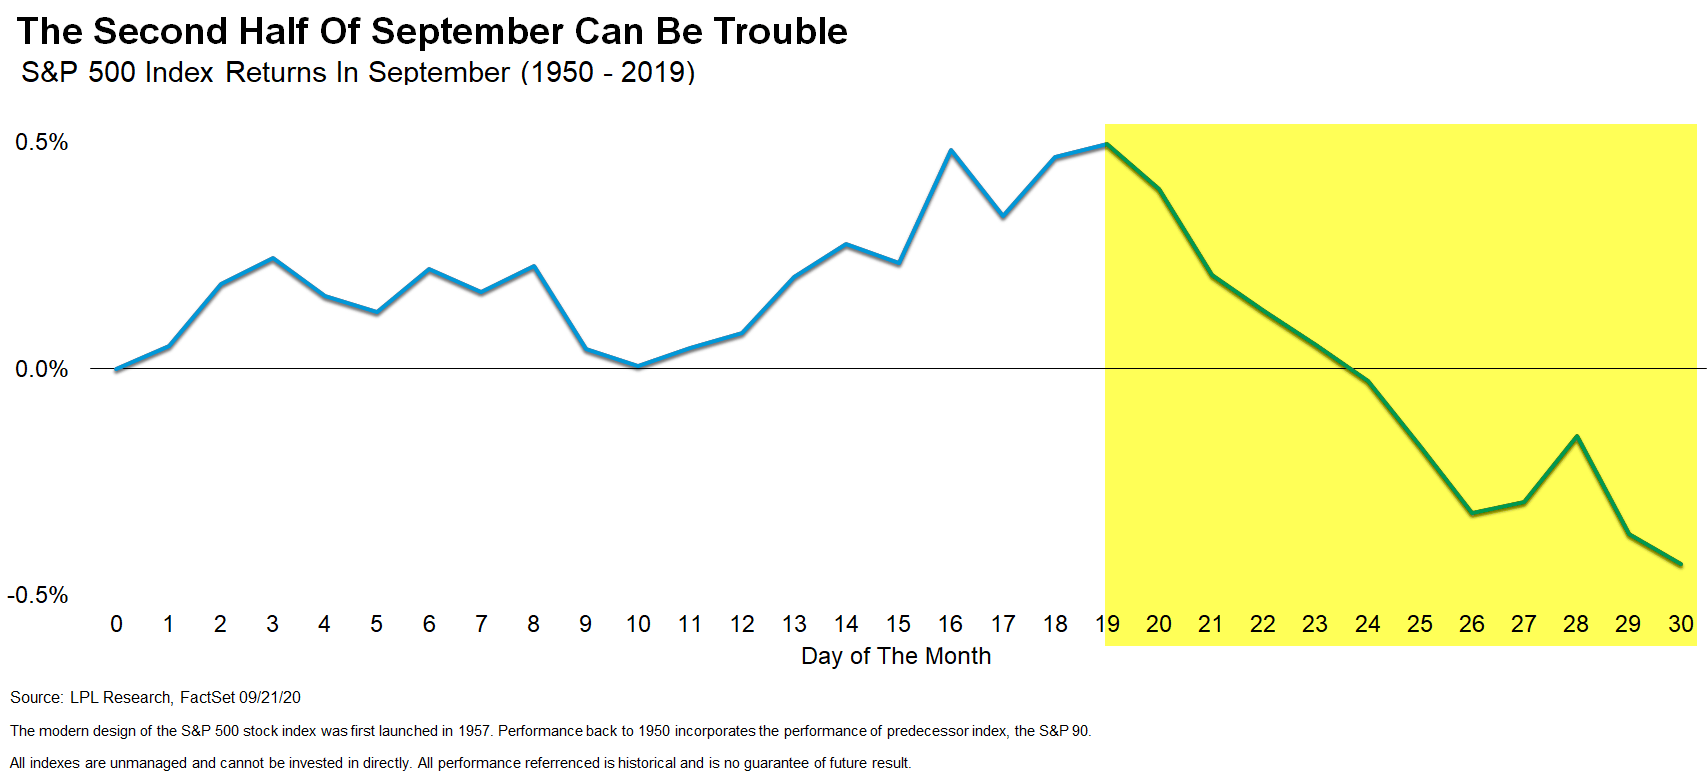
Speaking of seasonal weakness, the second half of September historically has been one of the worst periods of the year for stocks, as shown in our chart below.
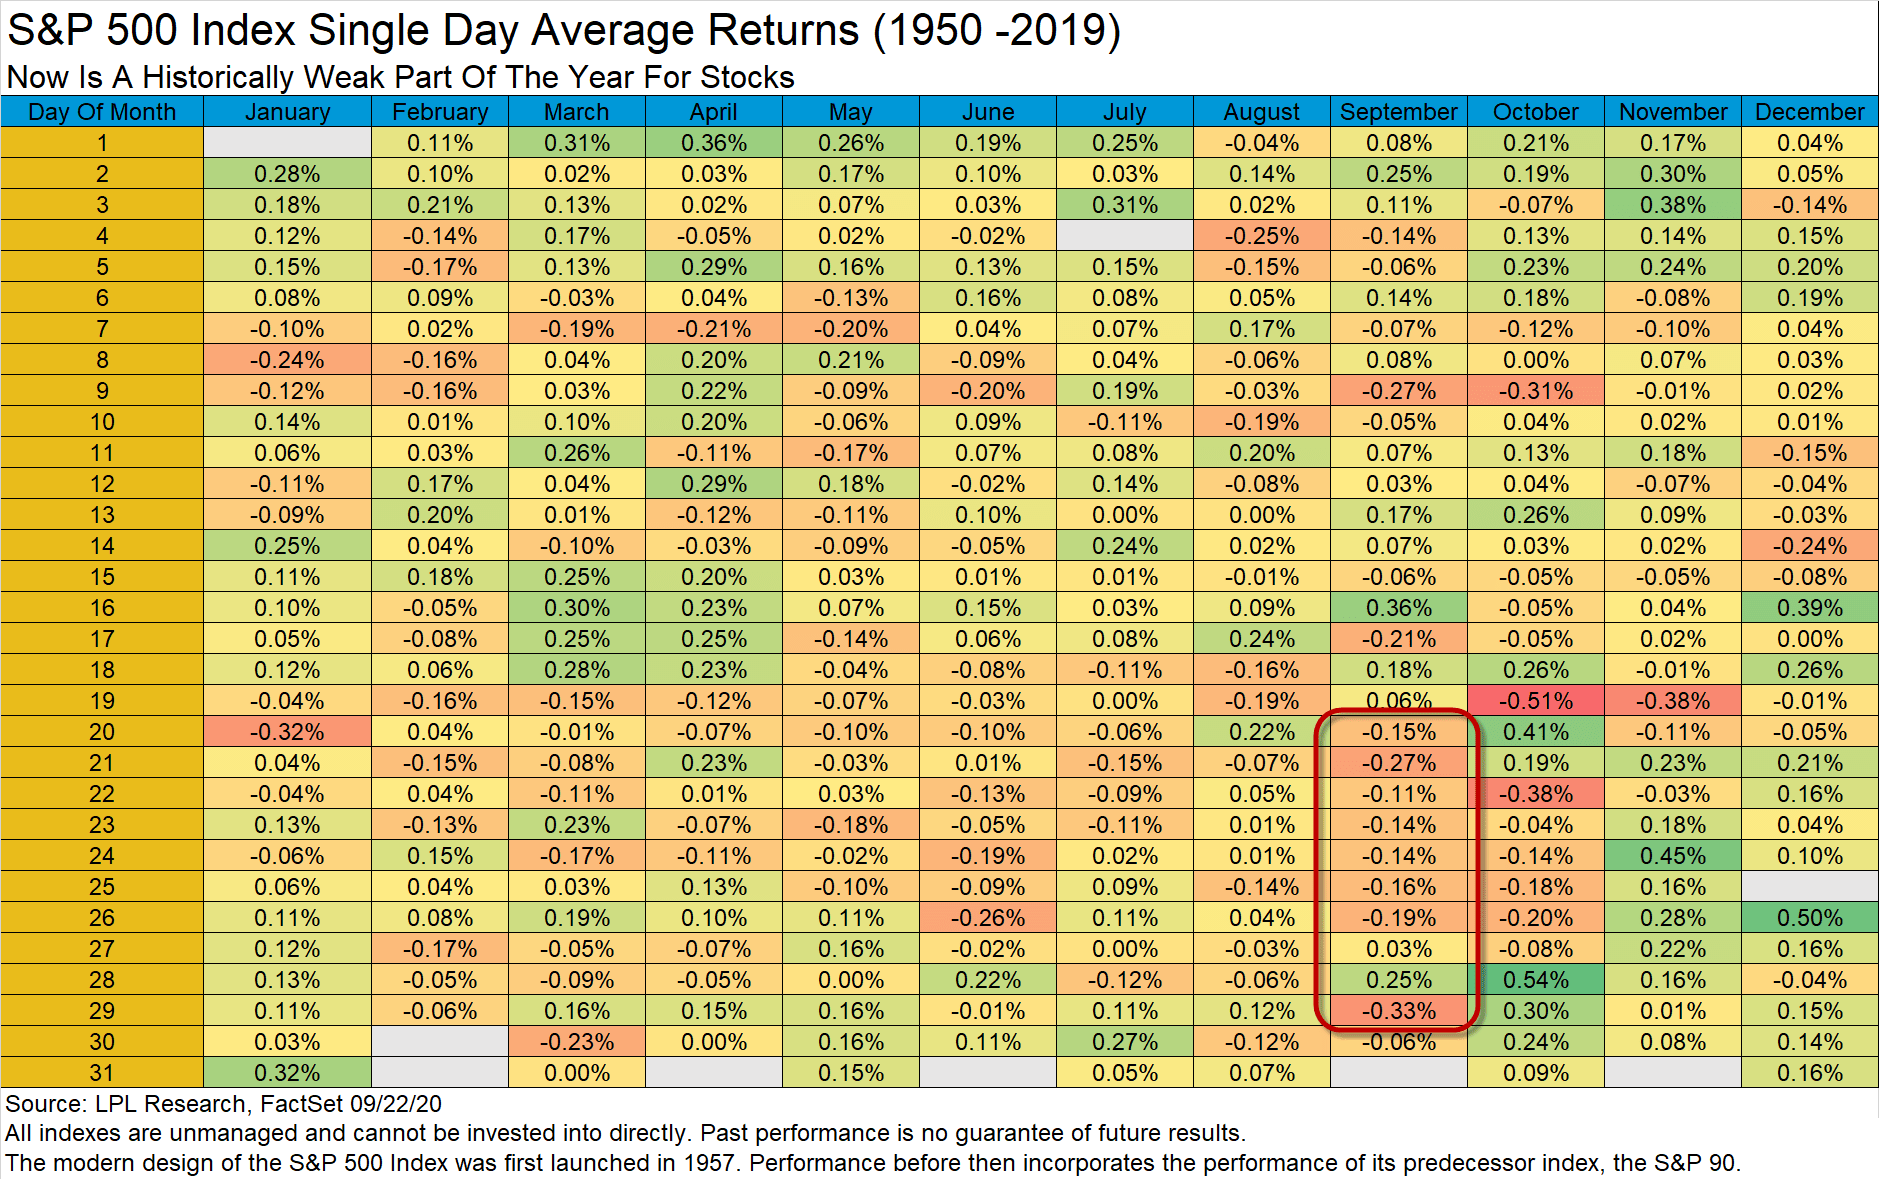
Another angle on this is showing how each day of the year does. Again, we are in the sweet spot for potential rocky seas.
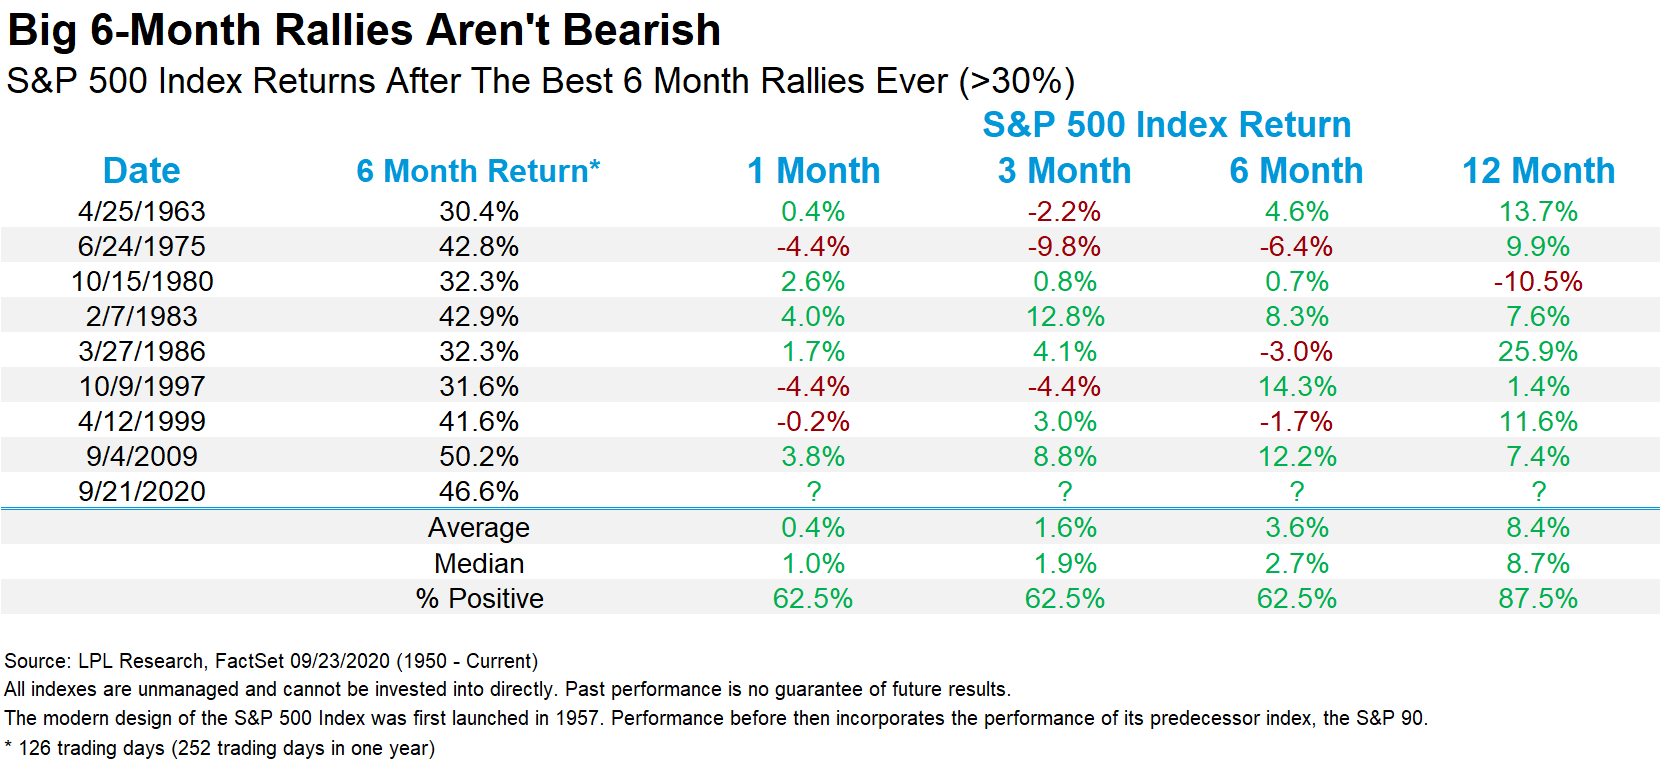
“To see some late-September weakness after a record 60% rally shouldn’t be too surprising,” explained LPL Financial Chief Market Strategist Ryan Detrick. “What might surprise some investors, though, is that after some of the previous best six-month rallies ever, in a lot of cases, the strength continued going out a year.”
As shown in the LPL Chart of the Day, the recent rally was one of the best six-month rallies ever for the S&P 500. Looking at all the previous rallies that gained at least 30%, returns are somewhat muted near term. But going out a full year, prices have typically moved higher, up seven out of eight times a year later.
IMPORTANT DISCLOSURES
This material is for general information only and is not intended to provide specific advice or recommendations for any individual. There is no assurance that the views or strategies discussed are suitable for all investors or will yield positive outcomes. Investing involves risks including possible loss of principal. Any economic forecasts set forth may not develop as predicted and are subject to change.
References to markets, asset classes, and sectors are generally regarding the corresponding market index. Indexes are unmanaged statistical composites and cannot be invested into directly. Index performance is not indicative of the performance of any investment and do not reflect fees, expenses, or sales charges. All performance referenced is historical and is no guarantee of future results.
Any company names noted herein are for educational purposes only and not an indication of trading intent or a solicitation of their products or services. LPL Financial doesn’t provide research on individual equities. All information is believed to be from reliable sources; however, LPL Financial makes no representation as to its completeness or accuracy.
All index and market data from FactSet and MarketWatch.
This Research material was prepared by LPL Financial, LLC.
Securities and advisory services offered through LPL Financial (LPL), a registered investment advisor and broker-dealer (member FINRA/SIPC).
Insurance products are offered through LPL or its licensed affiliates. To the extent you are receiving investment advice from a separately registered independent investment advisor that is not an LPL affiliate, please note LPL makes no representation with respect to such entity.
- Not Insured by FDIC/NCUA or Any Other Government Agency
- Not Bank/Credit Union Guaranteed
- Not Bank/Credit Union Deposits or Obligations
- May Lose Value
For Public Use – Tracking 1-05059795