Market Blog
Index Performance
S&P 500 Index: 1.8%
Dow Jones Industrial Average: 1.9%
Nasdaq Composite: 1.5%
US and International Equities
As news concerning President Trump affected Friday’s markets, the S&P 500 Index still managed to end the week higher. Energy has been the worst-performing sector now for two consecutive weeks. The best performing sectors were real estate, utilities, consumer discretionary, technology, as well as the financials. Growth managed to outperform value by over 1%. Moreover, mid and small caps had solid performances this week, with both markets up over 3.5%.
Even though the Chinese markets were closed for their holiday, international equities ended the week higher, with both the MSCI EAFE and MSCI EM indexes up over 1.5%.
Fixed Income, Currencies, and Commodities
Fixed income, as denoted by the Bloomberg Barclays US Aggregate, finished lower as did most bond asset classes. Emerging Market debt, as denoted by high JP Morgan Emerging Markets Global Bond, was a top performer by just finishing in the green this week.
Commodities ended the week mixed. Silver was a solid performer, finishing the week up over 5%. Gold also ended the week positive. The US dollar posted its largest weekly gain since early April last week; however, it managed to finish lower vs. the euro this week.
One of the better economic signs we’ve seen is the strength in copper recently, as copper is used all over the world as a very important industrial metal. On Thursday it fell more than 5% for the worst day since March. It is worth noting this took place during the Chinese Golden Week holiday. Given China buys a large part of the world’s copper, this may explain the decline. Nevertheless, this is worth watching and if copper continues to weaken, this could be a clue the overall global economy could be faltering as well.
US and International Economic Data Recap
The Conference Board’s Consumer Confidence Index jumped to over 101 from August’s 86, beating estimates by the most since November 2011 and delivering the largest month-over-month increase since April 2003. The majority of the previous largest monthly increases occurred at the end of a recession or beginning of a new expansion. Given the consumer makes up two-thirds of gross domestic product (GDP), this could bode well for the recovery.
Initial jobless claim filings declined by 33,000 to over 835,000 for the week ending September 26 (source: US Department of Labor). This was better than Bloomberg’s consensus expectations calling for 850,000. Continuing claims fell by roughly 800,000 to 11.8 million (week ending September 19). The pace of job recovery had slowed some, evidenced by the over 2% decline in personal consumption expenditures for August reported by the Bureau of Economic Analysis. An additional stimulus may still be needed.
“This October surprise raises the already high level of political uncertainty markets are dealing with as Election Day approaches,” said Jeff Buchbinder, equity strategist at LPL Financial.
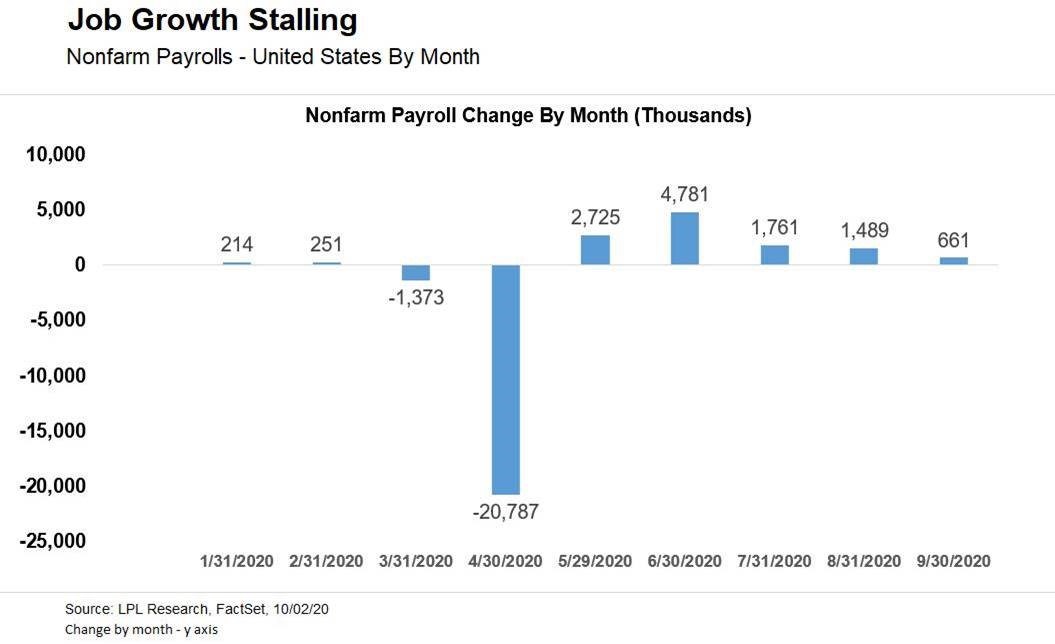
Hiring slowed during the past month, as the September nonfarm payrolls release showed the labor market added over 660,000 jobs, which was short of Bloomberg consensus expectations of under 860,000. However, revisions added over 140,000 to the payroll numbers from the two months prior. The unemployment rate fell to 7.9%, which was ahead of the consensus expectations. Growth in the labor market has slowed in recent months, permanent job losses have increased, and we’ve seen more corporate layoff announcements amid fading stimulus and rising COVID-19 cases (source: Bureau of Labor Statistics).
Looking Ahead
Next week, the following economic data is slated to be released:
- To begin the week, the September Purchasing Managers’ Index along with the Institute for Supply Management (ISM) Non-Manufacturing report is announced Monday. In addition, September domestic auto sales will be published.
- On Tuesday, we get the US Bureau of Labor Statistics’ August Job Opening and Labor Turnover Survey along with August’s balance of trade.
- On Wednesday, we find out about August’s consumer credit report.
- Thursday provides investors with another anticipated weekly initial unemployment claims report.
- Friday wraps up the week with August’s wholesale inventories.
IMPORTANT DISCLOSURES
This material is for general information only and is not intended to provide specific advice or recommendations for any individual. There is no assurance that the views or strategies discussed are suitable for all investors or will yield positive outcomes. Investing involves risks including possible loss of principal. Any economic forecasts set forth may not develop as predicted and are subject to change.
References to markets, asset classes, and sectors are generally regarding the corresponding market index. Indexes are unmanaged statistical composites and cannot be invested into directly. Index performance is not indicative of the performance of any investment and does not reflect fees, expenses, or sales charges. All performance referenced is historical and is no guarantee of future results. All market and index data come from FactSet and MarketWatch.
Any company names noted herein are for educational purposes only and not an indication of trading intent or a solicitation of their products or services. LPL Financial doesn’t provide research on individual equities. All information is believed to be from reliable sources; however, LPL Financial makes no representation as to its completeness or accuracy.
U.S. Treasuries may be considered “safe haven” investments but do carry some degree of risk including interest rate, credit, and market risk. Bonds are subject to market and interest rate risk if sold prior to maturity. Bond values will decline as interest rates rise and bonds are subject to availability and change in price.
For a list of descriptions of the indexes referenced in this publication, please visit our website at lplresearch.com/definitions.
This Research material was prepared by LPL Financial LLC.
Securities and advisory services offered through LPL Financial (LPL), a registered investment advisor and broker-dealer (member FINRA/SIPC).
Insurance products are offered through LPL or its licensed affiliates. To the extent you are receiving investment advice from a separately registered independent investment advisor that is not an LPL affiliate, please note LPL makes no representation with respect to such entity.
- Not Insured by FDIC/NCUA or Any Other Government Agency
- Not Bank/Credit Union Guaranteed
- Not Bank/Credit Union Deposits or Obligations
- May Lose Value
For Public Use – Tracking 1-05062850